Examples
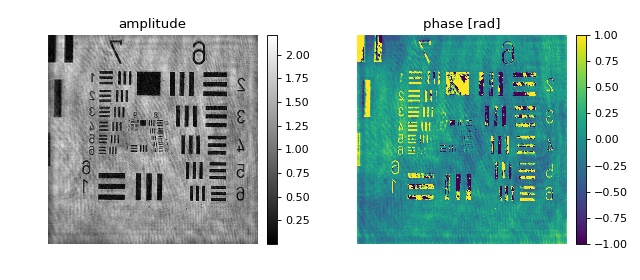
Hologram from tif file
This example illustrates how to retrieve phase and amplitude from a hologram stored as a tif file. The experimental hologram is a U.S. Air Force test target downloaded from the Submersible Holographic Astrobiology Microscope with Ultraresolution (SHAMU) project [BBL+17]. The values for pixel resolution, wavelength, and reconstruction distance are taken from the corresponding Python example.
The object returned by the
get_qpimage <qpformat.file_formats.dataset.SingleData.get_qpimage()
function is an instance of qpimage.QPImage
which allows for field refocusing. The refocused QPImage is
background-corrected using a polynomial fit to the phase data at locations
where the amplitude data is not attenuated (bright regions in the amplitude
image).
 1import urllib.request
 2import os
 3
 4import matplotlib.pylab as plt
 5import qpformat
 6
 7
 8# load the experimental data
 9dl_loc = "https://github.com/bmorris3/shampoo/raw/master/data/"
10dl_name = "USAF_test.tif"
11if not os.path.exists(dl_name):
12    print("Downloading {} ...".format(dl_name))
13    urllib.request.urlretrieve(dl_loc + dl_name, dl_name)
14
15
16ds = qpformat.load_data(dl_name,
17                        # manually set meta data
18                        meta_data={"pixel size": 3.45e-6,
19                                   "wavelength": 405e-9,
20                                   "medium index": 1},
21                        # set filter size to 1/2 (defaults to 1/3)
22                        # which increases the image resolution
23                        holo_kw={"filter_size": .5})
24
25# retrieve the qpimage.QPImage instance
26qpi = ds.get_qpimage()
27# refocus `qpi` to 0.03685m
28qpi_foc = qpi.refocus(0.03685)
29# perform an offset-based amplitude correction
30qpi_foc.compute_bg(which_data="amplitude",
31                   fit_profile="offset",
32                   fit_offset="mode",
33                   border_px=10,
34                   )
35# perform a phase correction using
36# - those pixels that are not dark in the amplitude image (amp_bin) and
37# - a 2D second order polynomial fit to the phase data
38amp_bin = qpi_foc.amp > 1  # bright regions
39qpi_foc.compute_bg(which_data="phase",
40                   fit_profile="poly2o",
41                   from_mask=amp_bin,
42                   )
43
44# plot results
45plt.figure(figsize=(8, 3.5))
46# ampltitude
47ax1 = plt.subplot(121, title="amplitude")
48map1 = plt.imshow(qpi_foc.amp, cmap="gray")
49plt.colorbar(map1, ax=ax1, fraction=.0455, pad=0.04)
50# phase in interval [-1rad, 1rad]
51ax2 = plt.subplot(122, title="phase [rad]")
52map2 = plt.imshow(qpi_foc.pha, vmin=-1, vmax=1)
53plt.colorbar(map2, ax=ax2, fraction=.0455, pad=0.04)
54# disable axes
55[ax.axis("off") for ax in [ax1, ax2]]
56plt.tight_layout()
57plt.show()
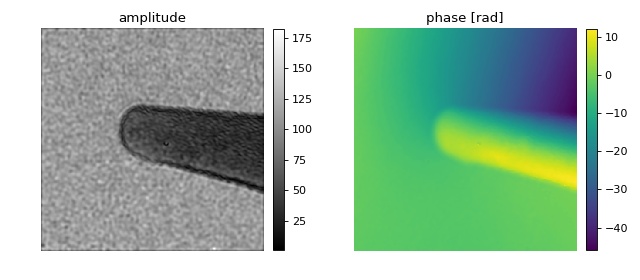
HyperSpy hologram file format
This example demonstrates the import of hologram images in the HyperSpy hdf5 file format. The off-axis electron hologram shows an electrically biased Fe needle [MLFDB15]. The corresponding HyperSpy demo can be found here.
 1import urllib.request
 2import os
 3
 4import matplotlib.pylab as plt
 5import qpformat
 6
 7# load the experimental data
 8dl_loc = "https://github.com/hyperspy/hyperspy/raw/RELEASE_next_major/" \
 9         + "hyperspy/misc/holography/example_signals/"
10dl_name = "01_holo_Vbp_130V_0V_bin2_crop.hdf5"
11if not os.path.exists(dl_name):
12    print("Downloading {} ...".format(dl_name))
13    urllib.request.urlretrieve(dl_loc + dl_name, dl_name)
14
15ds = qpformat.load_data(dl_name,
16                        holo_kw={
17                            # reduces ringing artifacts in the amplitude image
18                            "filter_name": "smooth disk",
19                            # select correct sideband
20                            "sideband": -1,
21                            })
22
23# retrieve the qpimage.QPImage instance
24qpi = ds.get_qpimage(0)
25
26# plot results
27plt.figure(figsize=(8, 3.5))
28# ampltitude
29ax1 = plt.subplot(121, title="amplitude")
30map1 = plt.imshow(qpi.amp, cmap="gray")
31plt.colorbar(map1, ax=ax1, fraction=.0455, pad=0.04)
32# phase in interval [-1rad, 1rad]
33ax2 = plt.subplot(122, title="phase [rad]")
34map2 = plt.imshow(qpi.pha)
35plt.colorbar(map2, ax=ax2, fraction=.0455, pad=0.04)
36# disable axes
37[ax.axis("off") for ax in [ax1, ax2]]
38plt.tight_layout()
39plt.show()
Conversion of external file formats to .npy files
Sometimes the data recorded are not in a file format supported by qpformat or it is not feasible to implement a reader class for a very unique data set. In this example, QPI data, stored as a tuple of files (”*_intensity.txt” and “*_phase.txt”) with commas as decimal separators, are converted to the numpy file format which is supported by qpformat.
This example must be executed with a directory as an
command line argument, i.e.
python convert_txt2npy.py /path/to/folder/
 1import pathlib
 2import sys
 3
 4import numpy as np
 5
 6
 7def get_paths(folder):
 8    '''Return *_phase.txt files in `folder`'''
 9    folder = pathlib.Path(folder).resolve()
10    files = folder.rglob("*_phase.txt")
11    return sorted(files)
12
13
14def load_file(path):
15    '''Load a txt data file'''
16    path = pathlib.Path(path)
17    data = path.open().readlines()
18    # remove comments and empty lines
19    data = [ll for ll in data if len(ll.strip()) and not ll.startswith("#")]
20    # determine data shape
21    n = len(data)
22    m = len(data[0].strip().split())
23    res = np.zeros((n, m), dtype=np.dtype(float))
24    # write data to array, replacing comma with point decimal separator
25    for ii in range(n):
26        res[ii] = np.array(data[ii].strip().replace(",", ".").split(),
27                           dtype=float)
28    return res
29
30
31def load_field(path):
32    '''Load QPI data using *_phase.txt files'''
33    path = pathlib.Path(path)
34    phase = load_file(path)
35    inten = load_file(path.parent / (path.name[:-10] + "_intensity.txt"))
36    ampli = np.sqrt(inten)
37    return ampli * np.exp(1j * phase)
38
39
40if __name__ == "__main__":
41    path = pathlib.Path(sys.argv[-1])
42    if not path.is_dir():
43        raise ValueError("Command line argument must be directory!")
44    # output directory
45    pout = path.parent / (path.name + "_npy")
46    pout.mkdir(exist_ok=True)
47    # get input *_phase.txt files
48    files = get_paths(path)
49    # conversion
50    for ff in files:
51        field = load_field(ff)
52        np.save(str(pout / (ff.name[:-10] + ".npy")), field)
Conversion of external holograms to .tif files
Qpformat can load hologram data from .tif image files. If your experimental hologram data are stored in a different file format, you can either request its implementation in qpformat by creating an issue or you can modify this example script to your needs.
This example must be executed with a directory as an
command line argument, i.e.
python convert_txt2tif.py /path/to/folder/
 1import pathlib
 2import sys
 3
 4import numpy as np
 5from skimage.external import tifffile
 6
 7# File names ending with these strings are ignored
 8# (these are files related to previous analyses)
 9ignore_endswith = ['.bmp', '.npy', '.opj', '.png', '.pptx', '.py', '.svg',
10                   '.tif', '.txt', '_RIdist', '_parameter', '_parameter_2',
11                   '_parameter_3', '_parameter_4', '_parameterdrymass',
12                   '_parameter_old', '_phase', 'n_array', 'n_array_1',
13                   'n_array_drymass1', 'n_array_drymass2', 'n_array_real',
14                   '~', '.dat']
15# uncomment this line to keep background hologram files
16ignore_endswith += ['_bg']
17
18
19def get_paths(folder, ignore_endswith=ignore_endswith):
20    '''Return hologram file paths
21
22    Parameters
23    ----------
24    folder: str or pathlib.Path
25        Path to search folder
26    ignore_endswith: list
27        List of filename ending strings indicating which
28        files should be ignored.
29    '''
30    folder = pathlib.Path(folder).resolve()
31    files = folder.rglob("*")
32    for ie in ignore_endswith:
33        files = [ff for ff in files if not ff.name.endswith(ie)]
34    return sorted(files)
35
36
37if __name__ == "__main__":
38    path = pathlib.Path(sys.argv[-1])
39    if not path.is_dir():
40        raise ValueError("Command line argument must be directory!")
41    # output directory
42    pout = path.parent / (path.name + "_tif")
43    pout.mkdir(exist_ok=True)
44    # get input hologram files
45    files = get_paths(path)
46    # conversion
47    for ff in files:
48        # convert image data to uint8 (most image sensors)
49        hol = np.loadtxt(str(ff), dtype=np.uint8)
50        tifout = str(pout / (ff.name + ".tif"))
51        # compress image data
52        tifffile.imsave(tifout, hol, compress=9)